High Strain Rate Characterization of Mg Alloys
Characterization of High Strain Rate Mechanical Behavior using 3D Digital Image Correlation
Yanli Wang, Hanbing Xu, Donald L. Erdman, Michael J. Starbuck and Srdjan Simunovic
Oak Ridge National Laboratory,
Oak Ridge, TN, 37831 E-mail: wangy3@ornl.gov
Introduction
Material response under dynamic crash loading is an essential aspect for automobile design to assess vehicle crashworthiness and improve safety performance. However, due to challenges in instrumentation, mechanical property characterization at strain rates of 0.1 s-1 to 103 s-1 is not standardized, although these conditions are most relevant to automotive collision.
First, in order to perform high speed mechanical tests in this strain rate regime, the testing machine actuator is required to have speed capabilities on the order of several hundred inches per second and necessary dynamic load capacity of several thousand pounds. Second, upon high speed loading, load cells used for force acquisition exhibit significant ringing and the noise in the signal due to wave propagation, inertia effects and the frequency response of the transducers. This often results in a great deal of uncertainty in stress analysis. Third, accurate strain measurements in the gage section become more difficult as strain rate increases. The most common method to estimate strains is based on the changes in actuator displacement, i.e., through the LVDT (Linear variable differential transformer). However, LVDT is not accurate at high speed due to their limited frequency response. Further, LVDT measurements consist of displacements of the loading train and deformations of the entire specimen, hence the contributions of the machine/loading train compliance to the outputs. Another popular technique for direct measurement of strains of using resistance strain gages is successful other than the limitations of localized measurements and limited measurement range. Recent advances in non-contact optical displacement/strain measurement methods are a solution to the challenges encountered by LVDT and strain gages . Digital Image Correlation (DIC) as one of the successful technique among the optical method family is employed in this study because of its capability of providing detailed information about displacement at each point on the sample surface using full field 3D image analysis.
Mechanical behaviors of light weight metals under dynamic loading have attracted more attention because of their potential applications in automotive industries to satisfy the goal of vehicle weight reduction and fuel efficiency improvement, and among which, magnesium alloys are being considered as one of the most promising structural material candidates because of their high strength-to-weight ratios. In this paper, we report on the development of techniques to generate reliable stress strain curves within the Sub-Hopkinson strain rate regime for sheet metal magnesium AZ31 specimens. The stresses are calculated from the elastic strain of the specimen measured in the tab region, and the displacement of the tensile specimens was successfully resolved with a DIC 3D high speed imaging system. Since this technique has major advantage over the conventional indirect measurements, the data analysis has avoided ambiguity and the results are more consistent.
Experimental High rate servo-hydraulic test machine
The heart of the high rate test machine (HRTM) consists of a custom high-rate actuator designed and built by MTS. Capacity is 9000 lbf at static conditions and 5500 lbf at maximum velocity of 700 in/sec. The stroke range is 15.5 inches of travel. The actuator has a single 400 gpm servo-valve supplied by two 5 gallon accumulators, all driven with an MTS 407 servo-hydraulic controller. The actuator is mounted in a recycled MTS 100 kip, two post load frame. Attached to the actuator is a slack adapter which allows the machine to travel up 7 inches before engaging and loading the specimen. This enables the machine to accelerate up to full speed and engage the specimen at constant velocity. Along with the slack adapter the other components of the load train that are specifically designed for high rate testing are low mass titanium alloy grips. The objective of reducing moving mass between the sample the load cell is to increase the Eigen frequency of the test set-up, hence its effect on the stress-strain curves during high strain testing is minimized.
For most situations, machine transducers include a DC strain gage load cell along with a charge amplified piezoelectric load cell (Kistler) with capacities up to 9000lbf. Actuator displacement is measure with a MTS Temposonic acoustic transducer due to the high velocities which would be outside the range of LVDT displacement measurements. All of the aforementioned are conditioned through the model 407 controller.
Data acquisition
Due to the unique requirements of the high rate testing, multiple data sources need for synchronization. Custom software was developed in-house. All software is written in LabView and the hardware for the data acquisition and control is primarily National Instruments (NI) products for ease of integration with LabView. The basic operation of the system consists of simultaneous synchronized signal generation and data acquisition on a NI multi-purpose M-series board (16 bit A/D, D/A, PXI 6251). The waveform from the control drives the external input to the servo-hydraulic model 407 controller which controls the high-rate actuator. Waveforms consist of linear ramps which result in constant velocities up to the maximum speed. The generated waveform is synchronized through software triggering to high speed digital image systems. An NI PXI chassis houses all data acquisition and control cards and communication to the controlling computer is done through a MXI-3 fiber optic interface. Additional cards are employed in the PXI chassis on an ad hoc basis depending on the channel count or specific need for various tests. Synchronization of all the data sources is within approximately 10 microseconds.
Digital Image System
3D Digital Image System is adopted in this study to improve sample design and analyze displacements of the gage section. The system is equipped with two high speed digital cameras (Photron FASTCAM SA5) which provide 7,500 frames per second (fps) at resolution of 1024x1024 pixels and reduced resolution operation to 1,000,000 frames per second. These two cameras are staged so that the area of interested on the sample is visible to both cameras.
Prior to the tests, a standard calibration procedure is performed to determine the camera parameters such as focal length, radial distortion coefficients, center position of the lens, skew of the sensor grid and the relationship between the two cameras. A rigid calibration grid with known spacing is used to perform the calibration. Within the depth of field, images are taken simultaneously while the calibration grid is placed to cover the image field and positioned to have tilt/rotation and translation along all three axes. An acceptable calibration for this study is when the standard deviation of residuals for a minimum 20 views of the calibration grid at various positions is less than 0.05 pixels. During the tensile tests, sequential images are simultaneously recorded by both cameras. The images are post-processed to form 3D deformation contours based on a pattern-matching algorithm using commercial software VIC-3D 2007 (Correlated Solutions, Inc ). This algorithm uses subset-based normalized cross-correlation criteria by comparing the reference subset in subsequent images. After analysis, Lagrangian strain, eLag, or engineering strain, eeng, can be extracted from the area of interest. For uniform deformation, these two types of strain are related through:
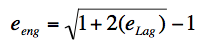
where eeng=(L-L0)/L0 with L0 and L defined as the original length and the deformed length of the specimen, respectively.
Materials and sample preparation
The tensile specimens are electric-discharge-machined from the as received AZ31 magnesium sheet metal along the rolling direction. The nominal specimen thickness is 1.9mm. The sample geometry is schematically shown in Figure 1. The 4-inch tab end was hooked to the load cells (known as the “fixed end”) and the 2-inch tab end was connected to the slack adapter through titanium alloy grips. CEA-06-125UN-350 strain gages (Vishay Micro-Measurements) are attached onto tab section 1.5 inches away from the grip and the gage section to minimize the effect of gripping and ensure uniform elastic deformation during entire loading process. Each specimen is sanded, cleaned employing typical strain gage techniques, and measured before being gauged. All strain gages are mounted with AE15 adhesive and cured for 3 hours at 140 degrees Fahrenheit. In addition, strain gages signals are conditioned through Vishay 2310 conditioners with wide-band filter.
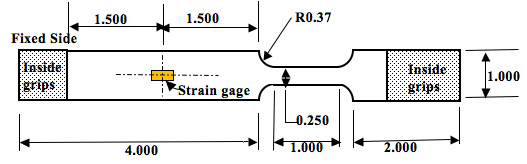
Fig. 1. Schematics of the tensile specimen geometry (dimensions are in inches).
The above specimen geometry for the studied material ensures uniform elastic deformation at the strain gage locations on the tab, therefore, the load can be backed out through Hooke’s law:
P = E eeng A0
where P is the load, eeng is the engineering strain, E is the elastic modulus and a value of 45 GPa was used for magnesium alloy, and A0 is the cross-section area of the tab. A random black and white speckle pattern was created on the specimen surface using Rust-Olem primer and Krylon ultra flat black spray paints. These patterns provide reference for Digital Image Correlation process. In order to improve adhesion between the spray paint and the specimen surface, specific surface treatment was performed. For specimens used for test speeds less than 10 in/s, the surfaces were sanded with 400 grit sand paper and cleaned with acetone, whereas those at test speeds higher than 100 in/s specimens were sandblasted. The paints were applied within 1 to 2 hours prior to the tensile tests as over-drying resulted in delamination of the paint when the test speed was higher than 100 in/s.
Results and Discussions Digital Image Correlation for Deformation
With the DIC system, a 3D full field deformation map is generated within the area of interested. In this study, information from the full field deformation map was used to assist specimen design and derive the true strain rate. Figure 2 depicts an example of the analysis for a specimen that was loaded at 10 in/s (strain rate of 10 s-1). The 3D Lagrangian strain plots are the results of DIC post analysis on the area of interested selected from the original image pairs taken by the high speed cameras.
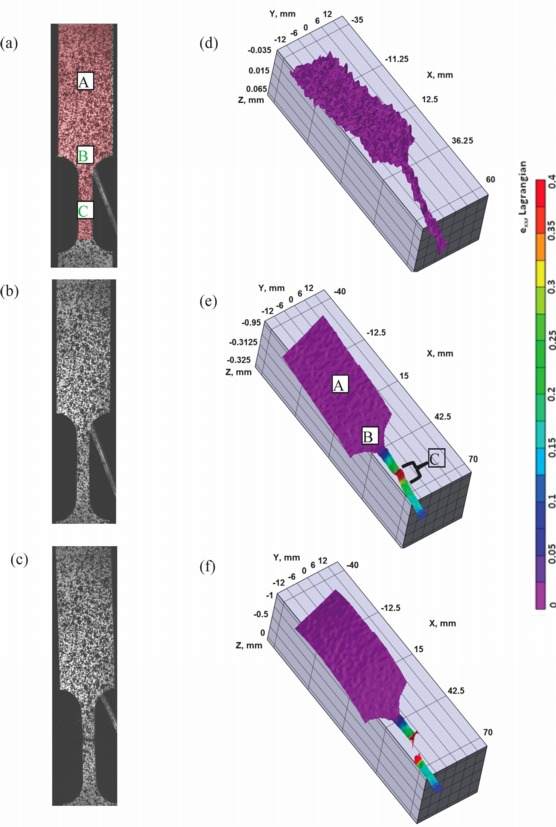
Fig. 2. Digital image correlation analysis with images taken by one of the cameras showing (a)before loading, (b) necking and (c)post test; the corresponding post analysis (d), (e ) and (f)show the full field Lagrangian strain fields. The highlighted region in (a) is the area of interest.
Prior to loading, this sample was found not to be perfectly flat (shown in Fig 2d), evidently shown from the 3D DIC post analysis. The warpage of the sample within the 1 inch gage section is approximately 0.1mm. This sample condition may be due to the combination of cold rolling process for the as-received sheet and EDM machining. Before the sample failed, the specimen exhibited significant necking behavior (the red region inside the gage in Fig. 2 e). The load train in this study is not perfectly stiff and there is some slack between the extension bars and the slack adapter and clevis attachments, hence the sample tends to experience some out-of-plane motion i.e., rotation around loading direction (x-direction ) and slightly shift position along Z-direction, as evidenced in images Fig.2 d to Fig.2f. It needs to be pointed out that, 3D Video Image Correlation (VIC) system processed the images and minimized error caused by out-of-plane motions in deformation measurement, and therefore the imperfections in the test setup do not affect the accuracy of the strain measurements.
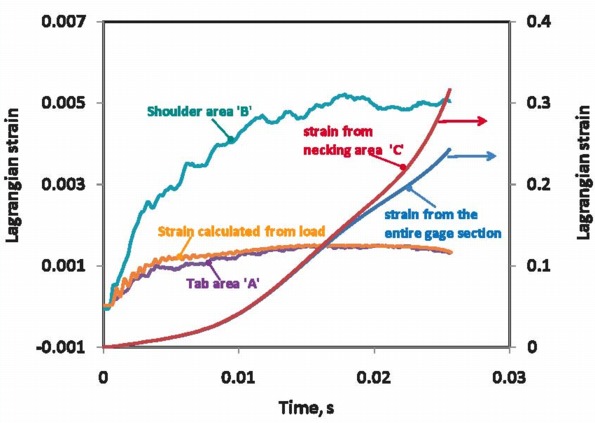
Fig. 3 Comparison of the Lagrangian strains on the specimen.
From the full field Lagrangian strain map, the local strains at various positions on the sample were extracted and compared in Figure 3. On the tab where the strain gage (see Fig. 1 and location ‘A’in Fig.2 ) is located, the maximum strain was measured to be 0.0015. This strain level confirms that the tab was under elastic deformation during the entire loading process. The strain at location ‘A’ matches well with the average tab strains backed out from load cell signal using equations 1 and 2. This sample geometry with tab width to gage width ratio to be 4 guarantees the tab only deforms elastically but the elastic strain in the tab is significant enough to be resolved accurately through strain gages or DIC. In addition, the slight differences between these two strains are due to instantaneous bending of the specimen during loading because of the compliance in load-train. Similar observations of instantaneous bending behavior under high strain rate were made by other studies. It is concluded that in order to obtain load values from elastic strains in the tab, the average values of both tab surfaces should be used. The comparison between the strains extracted from the necking region ‘C’ and the average strains from the entire gage section indicates that the specimen deformed uniformly to ~13% and then deform locally at location ‘C’. The average strain rate for this test calculated from the uniform plastic deformation region is 9.7 s-1 and close to the nominal strain rate of 10 s-1 .
Summary
3D Digital Image Correlation technique is successfully applied to high speed tests at up to 1000 s-1 . Because the load-train cannot be perfectly stiff, the specimens may experience rotation and shift during test. Post analysis using Digital Image Correlation can compensate for these effects and resolve true sample deformation without being affected by the out-of-plane motion. It is also found that when elastic strains from the specimen tab are used to back out stresses, the average value of the surface strains on both tab surfaces is shown to provide reasonable results.