High Strain Rate Characterization of Mg Alloys
Instructions for Use
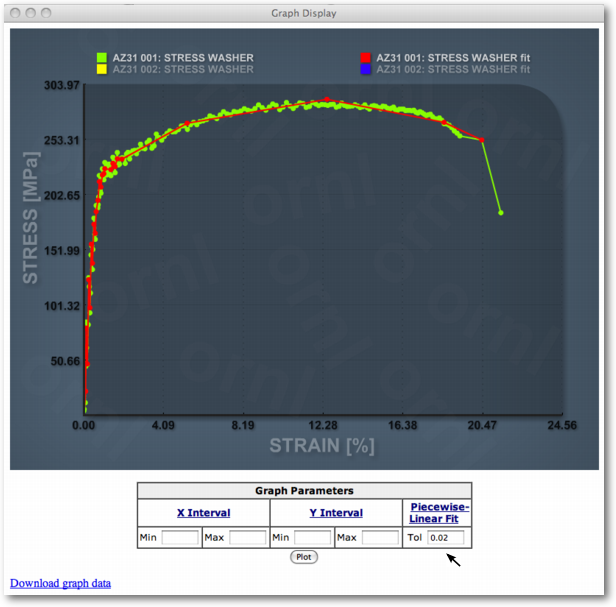
Step 4: Additional Data Processing and Download
You can also generate optimal piecewise linear interpolation for all the test data curves in the displayed graph by specifying tolerance parameter Tol and clicking on Plot button. The tolerance parameter is specified as a fraction of the total Y data range for the data, e.g. tolerance parameter value of 0.02 corresponds to 2% of the Y test data range.
Interpolated curves are included in Download graph data link. These curves can be used for material models such as Piecewise Linear Plasticity Model in LS-DYNA. Note that the data first has to be converted into true stress - true strain form.