High Strain Rate Characterization of Mg Alloys
Instructions for Use
Step 3: Display and Download Data
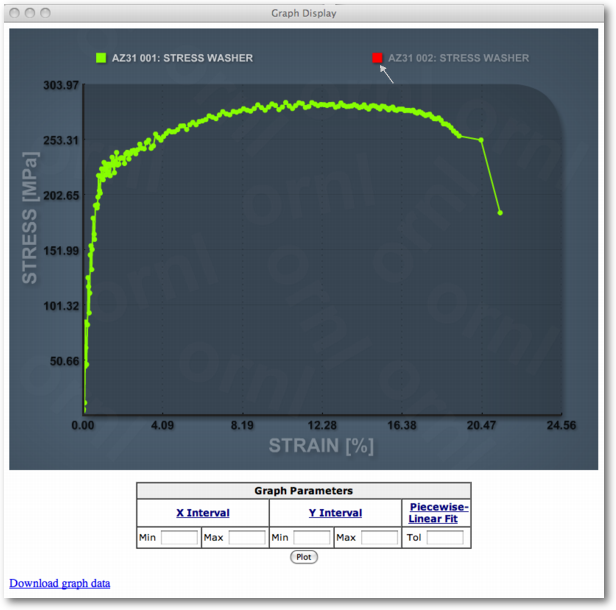
If selected data from the tests is compatible, a new window with the resulting graph will open.
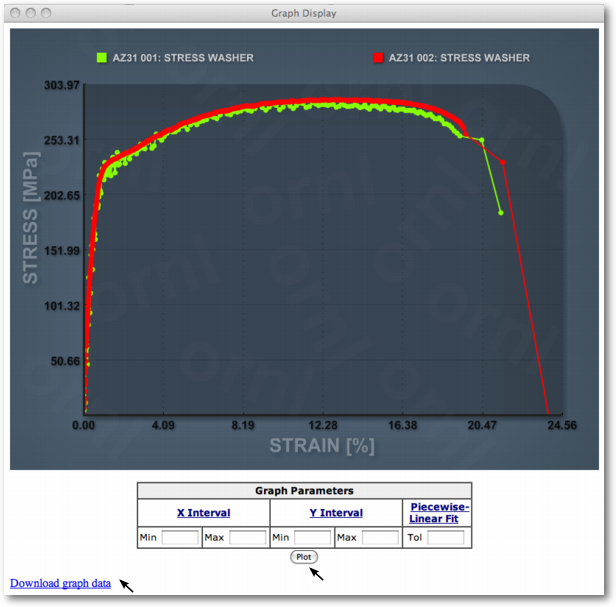
The data region of interest can be modified by specifying X Interval and Y Interval and pressing the Plot button. Data can be downloaded by clicking on Download graph data link. Print or save the graph image by mouse right-click inside the graph.
To reset a specific limit of the display region, just delete the content of the respective Min and/or Max boxes.
Data curves can be toggled in the graph display by clicking on the curve labels in the legend.