Tractor Model Development

Detailed description of the tractor model development can be found in Phase A report.
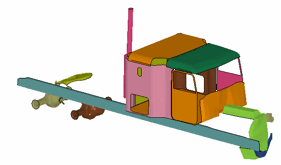
The latest version of the tractor finite element (FE) model (tractor_V01b) developed by the National Crash Analysis Center (NCAC) was used as the starting point for the tractor model. The original model was developed for the purpose of simulating tractor-trailer crash events with particular emphasis on those crash events involving roadside safety hardware (e.g., bridge rails, median barriers, etc.).
The intended application of the model is to be a "bullet" vehicle for evaluation and design of roadside safety features being struck by a tractor based on National Cooperative Highway Research Program (NCHRP) Report 350 evaluation parameters. The intended use of the model must be considered in determining what constitutes "good enough" regarding the fidelity of the model. Reduced-element ("bullet") models such as this are not considered valid for general applications due to the lack of geometric detail of components and connections, and/or omission of various components. These simplifications have a cumulative affect on the accuracy of the results produced by the model; so the intended application of the model must be considered in its development.
Based on the assessment of the original model, aspects of the model that were deemed critical for further improvement of simulating vehicle response in impacts with roadside safety hardware were identified and corresponding modifications were made to the model.
Modifications to the Original Model
Finite Element Mesh
The original version of the tractor model had 50,344 nodes, 46,470 elements, and 361 part definitions. Typical element sizes for non-structural components in the model, such as the hood and doors, were 25 - 150 mm and typical element sizes for structural components, such as main frame rails, were 30 - 50 mm. There were some elements in the model that were smaller that caused a relatively small critical time-step for the analysis. For example, there were approximately 75 elements with a critical time step less than a microsecond. "Mass scaling" was used to add mass to these small elements to achieve the desired time step. Most of these elements were in non-critical areas of the model - e.g., the door handle on the storage compartment of the sleeper. These parts were remeshed to improve element quality and computational performance.
The original model used the least computationally expensive element formulations and default options on hourglass stabilization. Stiffness-based hourglass control is better suited for parts that experience large deformations and does not significantly increase computational time. For all types of elements in the original vehicle model, the number of integration points is set at the default value. In light of the model's purpose, such decision is prudent because the number of integration points tend to linearly increase the simulation time. However, for the important structural parts, such as the main-frame and the parts that are expected to bear the brunt of the impact force, five integration points through thickness is the currently accepted minimum because default two points may make the shell too soft and deform too abruptly.
The target minimum time-step for the modified mesh was 1.4 microseconds. There are approximately 100 elements with a minimum time-step less than the target minimum. Using mass scaling to enforce the 1.4 microsecond time-step resulted in a total of 7 lb added to the model - which was distributed over those 100 elements.
Overall Mass Distribution and Inertial Properties
An initial assessment of the overall mass distribution in the tractor FE model was made based on a comparison to the Freightliner FLD120 tractor used in Test 03008 performed at the Federal Outdoor Impact Laboratory (FOIL). The total mass of the tractor model was 7,485 kg and the total curb mass of the actual tractor was 7,644 kg. The model was 159 kg (350 lb) too light, which is only a 2% error. The error in mass distribution in the FE model resulted in an error in the center of gravity of 210 mm (9% error) rearward and 26 mm (2.5% error) to the right of the center of gravity measured from the test vehicle.
Because the model was developed as a "bullet" model, many components of the vehicle were not included. The developers were careful to ensure that all structural members were accounted for in the model, but many non-structural members were excluded. Although these components may not contribute significantly to the overall stiffness of the vehicle, they do affect the local and global inertial properties. These masses and their locations must be accounted for in the model.
This is typically done in one of three ways: 1) discrete mass elements added to the nodes at the location of the missing components; 2) increase material density for parts in the vicinity of the missing components; or 3) modify the geometry of the parts (e.g., increased thickness of shell elements) in the vicinity of the missing components. The preferred method would be to add mass to the nodes at exactly the location of the missing components. Modifying the material density would be the second choice because this would likely result in distribution of the mass over a much larger area and it would affect the dynamic response. To avoid over stiffening the model, increasing the element thickness should not be used as a method to increase mass unless the component is non-structural and is not expected to deform significantly during analysis.
The FE model did not include any discrete nodal masses. The mass of the missing components were accounted for by increasing material densities or increasing thickness of structural elements.
Material Assignments and Characterization
Regardless of the amount of geometric detail and mesh refinement of a FE model, realistic results can not be obtained without proper characterization of material properties of the various model components. Metals, such as steel and aluminum, are relatively easy to characterize using standard material models available in most commercial FE codes. LS-DYNA, for example, has several material models appropriate for simulating the behavior (including thermal and strain-rate effects) of metals.
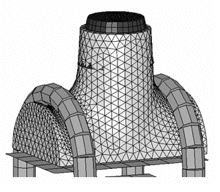
Assessment of Geometric Accuracy of the Major Structural Components
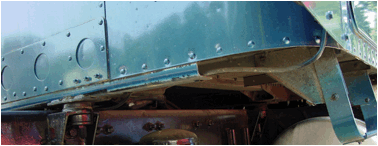
The initial shape, thickness, and geometric detail of major tractor structural components will directly affect overall vehicle stiffness, mass, and deformation modes during crash simulation. We visited a Freightliner dealership to survey tractors of similar make and model to the FE model. Measurements were taken of several components of the vehicle and compared to the model. In almost all cases involving structural members, such as frame rails and frame rail cross bracing, the thickness of the components measured on the physical vehicle was consistent with the thickness of the corresponding component in the model. For many of the non-structural components such as the truck cabin, fenders, hood, fuel tank, etc., the thickness was different from the actual component's thickness. In some cases, the exact thickness could not be measured due to restricted access to the part or because the part was a composite of several layers of sheet metal riveted together.
The geometry of the structural components in the model corresponded reasonably well with the physical geometry; however, all radii in the physical geometry are represented as straight corners in the FE model due to the size of the elements for the FE mesh. In the process of improving the model, refinements of the mesh were made in many regions of the model, but improvements to the geometry of most of these components were not. Increased geometric fidelity was not possible without access to the CAD geometry. Detailed reverse-engineering of parts was out of scope of the project.
Assessment of Suspension Components, Connections, and Failure Modes
An important aspect of a bullet vehicle model is its ability to simulate the overall kinematics of the vehicle in an impact event, which implies the existence of accurate models for mass distribution, global bending stiffness, torsion stiffness, and response of wheels and suspension components. For example, when a vehicle impacts a concrete safety shape barrier (e.g., F-shape and New Jersey shape barriers) at oblique angles, the spinning wheels of the vehicle tend to climb the barrier, which can significantly affect the dynamic behavior of the vehicle and, consequently, affect the loading on the barrier. If such capability is missing in the model, the simulation results can not be expected to provide reliable information regarding performance of the roadside safety barrier.
Front Leaf Spring Suspension
One of the primary uses of the tractor model will be to simulate NCHRP Report 350 Test Level 5 impacts into longitudinal barriers. These impact scenarios involve an 80,000-lb (36,000 kg) tractor-trailer impacting the barrier at 50 mph (80 km/hr) at an impact angle of 15 degrees. In such an impact scenario, the front tires and front axle are the first to experience the brunt of the impact force, thus these components must be modeled in sufficient geometric and material detail.
A basic assessment of the front suspension model of the tractor revealed several areas that could be corrected to enhance the crash performance of the vehicle. The areas of concern are related to:
- Geometric and mesh discretization of the geometry of the leaf springs
- Over-constraint of the leaf springs, limiting their range of motion
- Material property definition of the leaf spring steel
- Missing critical components in the linkage of the leaf spring system to the frame rail of the tractor
- Preload of suspension under gravity loading
- Geometric and stiffness representation of the suspension-stop
- Inability of the wheels to steer
- Missing steering linkage between left and right wheels.
No failure criteria were defined for U-bolts, shear pins, suspension mounts, etc., in the original tractor model. Failure of one or more of these components is always observed in actual crash tests, which directly influences tractor kinematics and post-impact behavior.
The tractor model's front suspension uses shell elements to model the leaf springs. The individual leaves are modeled with a uniform thickness of 12 mm, whereas the physical components taper from a thickness of 16 mm at the center to approximately 7-9 mm at the end. Also, several nodal rigid body constraints are used that prevent the leaves from sliding against one another and prevent the leaf spring system from rotating at the pinned connections to the frame rail. The leaf spring material is characterized as a relatively mild steel with yield strength of 50,750 psi (350 MPa), whereas the physical components are expected to have a yield strength much higher - approximately 181,297 psi (1,250 MPa).
The suspension geometry in the tractor model was based on its equilibrium position under the weight of the sprung mass of the truck; however, the model did not account for any preload in the suspension components. Consequently, the sprung mass of the truck displaced significantly downward when gravity was applied to the model. A study was performed to investigate a better method of modeling the suspension system. A methodology was identified, which involves pre-stressing the leaves in the leaf-spring assembly to account for the gravity load of the tractor. This method provided very promising results and was relatively easy to implement. Researchers at Midwest Roadside Safety Research Facility (MwRSF) recently applied this same methodology to modeling the leaf springs on the rear of the NCAC C2500 model with good results.
Leaf Spring Suspension Characterization
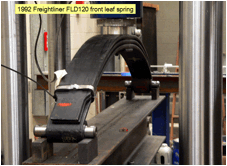
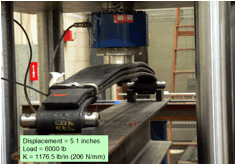
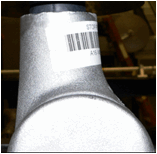
A leaf spring assembly for a 1992 Freightliner FLD120 tractor was purchased from a local Freightliner dealer. A laboratory test was conducted to measure the force/velocity response of the leaf spring assembly. The test was carried out using a MTS uniaxial machine.
The leaf-spring purchased from the local Freightliner dealer was digitized. A 3-D geometric rendering of the part was produced using Pro-Engineer(TM) CAD software and HyperMesh(TM) was used to create the FE mesh of the component. Two modeling approaches were investigated:
- Thick shell element approach
- Thin shell element approach.
Thick Shell Model
The advantages of modeling the part with thick shell elements are apparent: the taper of the leaves are accounted for exactly and explicitly in the mesh, initial penetration between leaves is easier to control (since the geometry is exact), and the thickness of the leaves suggests that they would be better characterized using thick shell theory. The analysis, however, resulted in an overly stiff response of the leaf-spring. It was also determined that the thick shell elements were not sufficiently `robust' under large deformations. Suspension components often experience significant deformation during impact with roadside safety barriers; so the computational model of these components must remain stable under high deformations in order for the model to be useful to practitioners.
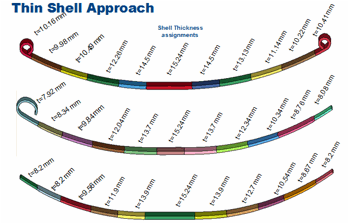
Thin Shell Model
The leaf spring was also modeled using thin shell elements. This model was a little more tedious to develop since the thickness of the elements were defined as a line in the input file rather than explicitly defined by the geometry of the mesh. The taper of the leaves was accounted for in the model in a piecewise manner. Each colored segment was defined as a separate part in the model and a representative thickness was assigned to each segment based on the average thickness of the segment (measured from the physical component).
A paper published in the ASM International Journal documents the results of a study where the failure of a leaf-spring in a sport utility vehicle was investigated. The study reported that fracture of the leaf-spring material occurred at the pin connection at a stress of 211,755 psi (1460 MPa).
The leaves of the leaf-spring model were meshed with full-integrated shell elements (type 16 in LS-Dyna) with warping stiffness turned on (hourglass control type 8). The material was modeled with yield stress of 181,300 psi (1,250 MPa) and failure strain set to 0.182 (corresponding to an ultimate stress of 211,755 psi). The typical element size used in the model was 20 mm long x 20 mm wide and the total number of elements was 1,380. The smallest time-step for an element in the mesh was 1.4 microseconds in an element located at the end of the leaf spring at the pin connection.
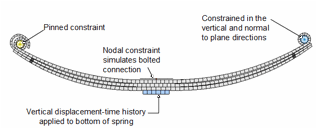
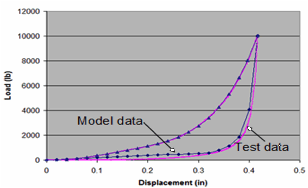
An analysis was conducted to evaluate the stiffness of the leaf-spring model based on a comparison with the laboratory test results. The boundary and loading conditions were modeled based on the test fixture used in the laboratory test.
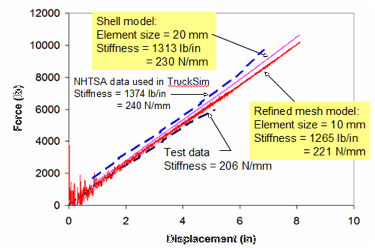
The response of the model resulted in a constant stiffness of 1,313 lb/in (230 N/mm) which compared relatively well with the response measured in the test (206 N/mm). As a further check of the model, the mesh was refined such that the typical element size was 10 mm x 10 mm. The refined mesh resulted in a stiffness of 1,265 lb/in (221 N/mm). It is expected that the response would continue to approach that of the test with further mesh refinement; however, the coarser mesh will be used for application in the tractor model to maintain a reasonable time-step for the analysis.
Gravity Preload of Leaf-Spring
The geometry of the tractor model is based on its equilibrium position under gravity loading. It is necessary then to properly position the leaf spring in the vehicle model in its preloaded state and accurately account for the pre-stress in the suspension components. The suspension is supporting approximately 4,845 lb (21,550 N) under gravity load.
An analysis was conducted to compress the leaf-spring model into its proper equilibrium position. The nodal coordinates of the suspension in this deformed state were extracted and put back into the leaf-spring model. The element stresses at this position were also obtained from the analysis (via *interface_springback option in LS-Dyna) and were used to apply pre-stress to the leaf-spring elements (via the *initial_stress_shell card in LS-Dyna).
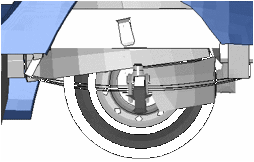
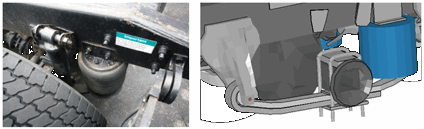
Suspension Displacement Limiter (Suspension Stop)
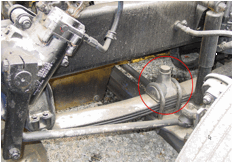
The suspension stop component limits the displacement of the leaf spring during compression. This component is made of cast aluminum and is positioned on top of the leaf spring directly over the axle. It is fastened to the leaf spring using two 0.825-inch diameter U-bolts. When the suspension is fully compressed the suspension stop will impact against the bottom of the truck frame rail. The suspension stop includes a rubber cylinder that is approximately 1.5 inches long inserted into the top of the suspension stop. This rubber cylinder extends slightly above the tip of the suspension stop to soften the impact against the frame rail.
The load-deflection response of the rubber tip was measured in the laboratory using displacement control on a uniaxial load machine. The displacement was ramped at a constant velocity from 0 to 0.417 inches in 447 seconds. The response of the rubber tip was characterized in the model using *mat_simplified_rubber_with_damage in LS-Dyna.
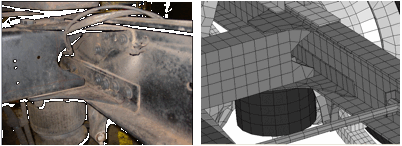
The geometry of the suspension stop is also important. The U-bolts that fasten the leaf spring to the front axle are also used to fasten the suspension stop to the leaf spring. The U-bolts are seated into a `saddled' groove on either side of the suspension stop. Without the proper geometry and proper contact defined between these components, their connection can not be properly modeled. The U-bolts were tightened using a pseudo-temperature to shrink a single element on each side of the U-bolts. This was done by defining a coefficient of thermal expansion on those elements and defining a temperature drop at the start of the analysis. The elements shrink due to the temperature change and `clamp' all the suspension components together. As the components compress together, the gaps between components close and a tensile force is generated in the U-bolts. This process was accomplished by iteratively decreasing the temperature until a pre-load of approximately 4,000 lb (17,793 N) was achieved.
The aluminum housing part of the suspension stop was modeled with tetrahedral elements with rigid material properties. The expected deformation of this part during impact was considered to be insignificant, e.g., the impact energy is absorbed primarily through deformation of the rubber cylinder. The geometry, on the other hand, was considered very important since achieving an accurate model of the connection of the leaf spring to the axle depends on having an accurate geometric model of the suspension stop and its contact with the U-bolt.
The model of this component was discretized with a very refined mesh in order to sufficiently capture the geometry. Note, however, that the number and size of these elements do not enter into computations (except for contact) since the material is characterized with rigid material properties.
The strength and failure of the U-bolts is also critical for accurately predicting and simulating failure of the connection. The material properties of the U-bolts are defined in the enhanced model based on properties of a grade 8 bolt, where the yield stress is assumed to be 129,920 psi (896 MPa). The failure strain was estimated to be 0.18. The U-bolt component should be tested in the laboratory to better define its properties.
Shock Absorbers
Shock absorbers have a significant influence on suspension response. Generally, these components have nonlinear and unsymmetrical behavior - i.e., different extension and compression response. The shock absorber in the original tractor model was modeled as a linear damper with damping constants that respond the same in compression and in extension.
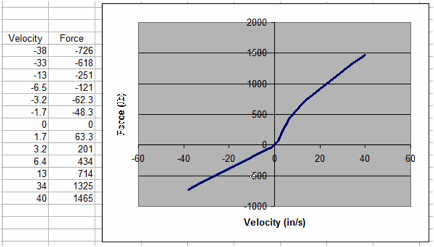
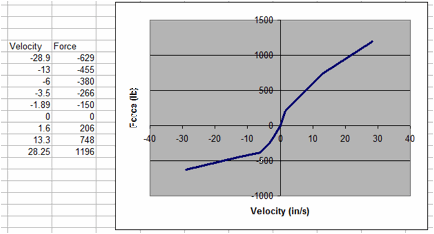
Front and rear shock absorbers were purchased and tested to determine their force-velocity response. The shock absorbers (Monroe Gas-Magnum) were tested in a uniaxial loading machine using sinusoidal displacement input with +-0.5 inch maximum displacement. Load-velocity data were collected for loading rates of 0.5, 1, 2, 4, and 8 Hz. The tests showed that the response of the shock absorber is effectively linear and symmetric for displacement rates less than 3 in/s, i.e., force increases linearly with displacement rate and the response is the same in extension and compression. At displacement rates higher than 3 in/s, however, the response is both nonlinear and non-symmetric with the response in extension being approximately 2 times higher in magnitude than the response in compression. Also, the shock absorber responds differently in compression for increasing velocity than it does for decreasing velocity. Similar tests were conducted on the rear shock absorber and the general response was very similar to that of the front shock absorber.
Compression Extension
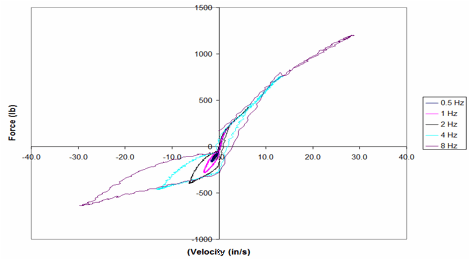
The shock absorbers are modeled in the enhanced model as discrete elements with response characterized using *mat_damper_nonlinear in LS-Dyna. The test data was processed to generate a force-velocity curve for input into the material model that `best defined' the response of the shock absorbers.
Rear Suspension
A cursory inspection of an actual Freightliner tractor rear suspension revealed that the leaf spring component of the rear suspension was very stiff - essentially rigid, and could be modeled as such - and the suspension response is primarily governed by the Airide suspension component. The rear suspension of the tractor model was modeled with a 2-leaf spring and a non-physical "place-holder" representation of an Airide suspension bag. The model of the rear tandem axles, the rear suspension, and their connection to the frame rails through the "place holder" of the Airide suspension effectively stiffened the truck structure and also affected the sprung mass response of the vehicle (e.g., the axles and the frame move as a single component).
The modifications to the rear suspension are summarized below:
- Removed all nodal rigid body constraints
- Made pin material rigid
- Made pin-bracket material rigid
- Connected pin to pin-bracket using spherical joints
- Connected suspension to pin using extra nodes for rigid bodies
- Connected bracket to frame rail using extra nodes for rigid bodies
- Modified thickness of air-ride suspension part from 10 mm to 4 mm
- Changed material of air-ride suspension part from steel properties to "rubber like" properties (for visual effects only)
- Added discrete elements to the suspension model to model response of Airide component (see following discussion for details).
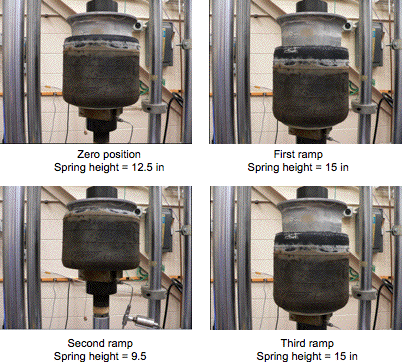
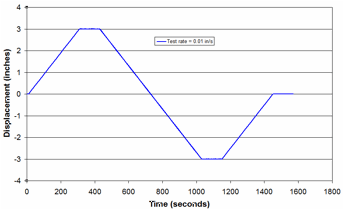
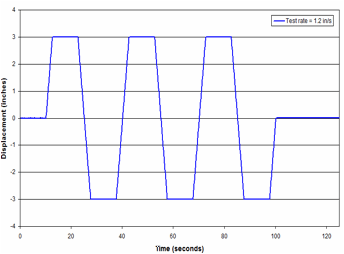
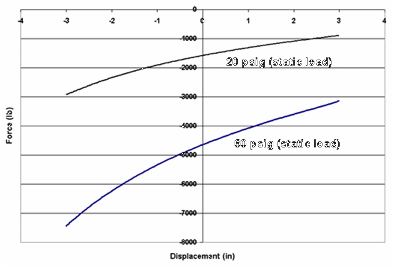
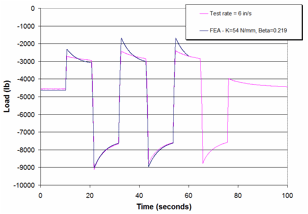
The rear suspension the 1992 Freightliner FLD120 tractor incorporates a Firestone Airide suspension, Part No. 1T15ZR6. Because of the complexity of modeling the Airide suspension component in geometric detail, an idealized characterization of the component was used in the enhanced model via discrete spring and damper elements. The suspension component was purchased from a local Freightliner dealer and a test program was developed and carried out in the Battelle labs to characterize the load response of the component for inclusion into the FE model. The response of this component is a function of internal pressure, deflection, and deflection rate. The test program was designed to collect necessary data for properly characterizing the response of the component for each of these factors. Tests were conducted at `bag pressures' of 20 psig, 40 psig, 60 psig, and 80 psig and deflection rates of 0.01 in/s, 1.2 in/s, and 6 in/s.
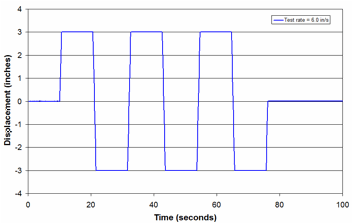
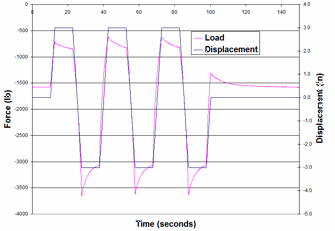
For each test, the "zero position" of the Airide component was set to mid-stroke, corresponding to a spring height of 12.5 inches, and held at this position while the internal air pressure in the component was set to the desired value. The tests were conducted under displacement control. Starting from the zero position, the displacement was ramped up 3 inches to a spring height of 15.5 inches, and the displacement was held at this position for a period of time (typically 10 seconds) to allow for relaxation/recovery of the load. The displacement was then ramped down 6 inches to a spring height of 9.5 inches, and again held for a period of time. The displacement was then ramped back up 6 inches to a spring height of 15.5 inches and again held. This process was repeated for two additional cycles.
The 20 psig and 60 psig bag pressures are significant since they correspond to the bag pressures for an unloaded tractor and an 80,000-lb tractor-trailer combination, respectively.
From the test results, it was determined that the Airide suspension response could be approximated by a three-parameter Maxwell model.
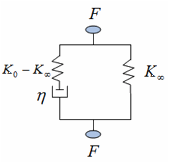
The behavior of this model can be described by:
When the component is given a prescribed displacement, d, and held at that position, the immediate load response is defined by F[0 ]= K*d and the long-term equilibrium response is defined by F[infty]= K[infty]*d. The parameter b = K/y corresponds to a time decay constant that governs the rate of force relaxation.
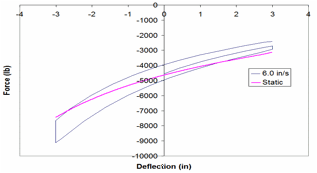
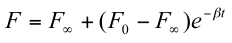
The material model library in LS-Dyna includes a three-parameter Maxwell model called *MAT_SPRING_MAXWELL. The input parameters for this model are given as constant coefficients for K, K[infty], b. To partially account for the nonlinear response, the Airide component was modeled using two discrete elements. One of the elements is characterized by the *MAT_SPRING_MAXWELL material model and the other is characterized with *MAT_SPRING_NONLINEAR_ELASTIC. The parameter, K[infty], in the Maxwell model was set to zero and the quasi-static (e.g., long-term) response was modeled using a non-linear elastic spring (K[ne]) characterized by a force-deflection curve obtained from laboratory tests on the Airide suspension at a "quasi-static" rate (0.01 in/s).
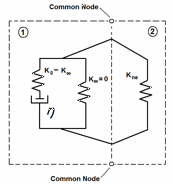
With the K[infty] in the Maxwell model set to zero, the *MAT_SPRING_MAXWELL model simplifies to a linear spring and damper in series. A portion of the force-time plot corresponding to creep of the component under fixed displacement was used to define the spring and damper constants for the *MAT_SPRING_MAXWELL model. The creep response is different for extension and compression; the compression response was used to calibrate the model.
The model replicates the test response very well in compression (which is the data used to calibrate the model), but does not accurately capture the rate behavior in extension. This is because the *MAT_SPRING_MAXWELL model in LS-Dyna is symmetric in extension and compression. Considering the application of the tractor model (e.g., crash analysis), it was concluded that the compression behavior of the suspension was more important than the extension and thus the model response was considered acceptable.
Component Connections
Component connector elements such as spotwelds, nodal rigid bodies, joints, weld elements, etc., in the tractor model need to be reviewed in some detail for appropriateness and compatibility with local mesh density and functional intent. As stated above, some areas of the tractor model were observed to be potentially over-constrained due to placement of nodal rigid bodies vs. local mesh refinement. The final choice and type of connector elements used will be determined after the final FE mesh is established, and will be dictated by larger functional requirements.
Tire Model
When a vehicle impacts an object such as a roadside safety barrier, one or more of its tires may deflate or "blowout" as the tire(s) interact with the object. Tire deflation affects the dynamics of a vehicle during impact because it alters the magnitude of forces and the mechanism of how those forces are transferred between various vehicle components. For example, during full-scale, low-angle impacts with longitudinal concrete barriers, the front, impact side tire of a vehicle often gets pushed back into the wheel housing. If the tire remains inflated during this event, the wheel will stack against adjacent parts and impose significant forces on its surroundings. The magnitude of these forces may be sufficient to cause deformation or failure of critical components (e.g., frame-rail or suspension), which will affect subsequent kinematic behavior of the vehicle.
The tires of the tractor model are modeled using a single part constructed of isotropic thin shell elements with constant thickness representing all regions of the tire, including side wall and tread. The air pressure inside the tire is simulated using the simple airbag option in LS-Dyna and cannot accurately simulate proper tire response. This method of modeling tires has been shown to produce unrealistic deformation and response of the tire during impact.
The development of a computationally efficient tire model that incorporates the critical parts of a tire structure such as the bead coils, radial fibers, rubber sidewall, under-belt radial fibers, steel belt, and tire tread simulation is considered important to model accuracy, but was beyond the scope of work in this project. Therefore, the tire model in the enhanced vehicle model remains unchanged.
